Article written by Yasaman Kazemi
Business supply chain leaders are working to keep goods flowing to customers in need as the novel coronavirus disease 2019 (COVID-19) international public health emergency presents new challenges each day.
So far, the impact of COVID-19 on global supply chains seems to mirror the pandemic’s impact on global health. For instance, once much of the local workforce near Wuhan, China, was under quarantine, Chinese manufacturing hit its lowest level of output since 2005. The effects spread outward—first to the shipping industry, which shouldered nearly US$2 billion in losses—and then to companies worldwide. Unable to obtain necessary parts, some firms suspended production.
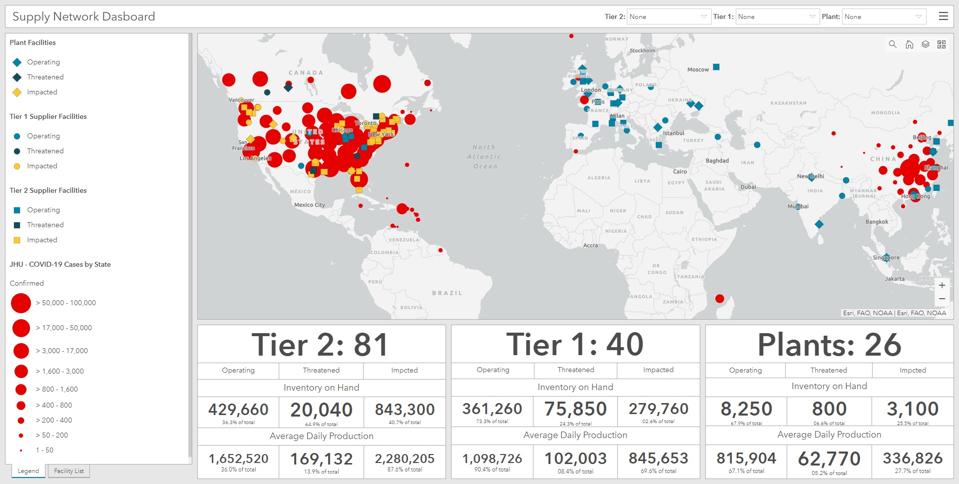
A dashboard visualizes the supply chain and how COVID-19 might affect operations.
ESRI
As recent developments have shown, global supply chains are especially susceptible to disruptions, both upstream and downstream. Supply chain strategy now goes far beyond reacting to disruptions, and leaders are looking for ways to prepare before impact. Successful companies create agility and flexibility in their supply chains by enhancing their risk management strategies, increasing the visibility and transparency in their processes, and exercising responsiveness. Most accomplish this by incorporating advanced analytics techniques.
The Challenge in Complex Systems
While today’s interconnected, globally dispersed supply chains help companies satisfy customer needs on demand, they also put businesses at greater risk. Surprisingly, only a small portion of companies around the world are capable of modeling supply chain disruptions and their impacts. This makes it more difficult to react in a timely manner when a catastrophe or crisis hits any part of the chain.
In addition to knowing the status of employees, many businesses need to know the status of facilities, including manufacturing plants, suppliers, distribution centers, and retail outlets. As the global economy endures a major slowdown, company executives want to know how and where to source raw materials, monitor goods in transit, and track available inventory. For some executives, the pandemic is a career-defining exercise in business continuity and recovery.
For manufacturers that have identified and mapped tier 1, tier 2, and ancillary supply chain partners, geographic information system (GIS) technology provides a live operating picture of that information, giving them the location intelligence to maneuver through disruptions such as hurricanes, fires, or health epidemics. The COVID-19 pandemic may be more dispersed and enduring than many natural disasters, but it presents similar challenges to executives and frontline personnel who must adjust business plans accordingly and in near real time.
Supply chain managers need ways to model and mitigate risk for the entire supply chain network, including tier 2 and tier 3 suppliers, right down to the moment a product reaches its end-point customer. But when there is limited interaction with suppliers, this kind of risk mitigation too often seems out of reach. When a company does not know the locations of its second- and third-tier suppliers and their dependencies, it may face several surprises with severe outcomes. As risks become more difficult to manage, the consequences may become more serious—and sometimes irreversible—for the entire value chain.
In any supply chain scenario, a key piece of intelligence for executives and frontline decision-makers is location awareness. The question then becomes: how and where can we better manage, anticipate, and limit the severity of disruptions? And as soon as possible, how and where can we anticipate the recovery of business?
An Intelligent Response Strategy
In recent years, one way companies have responded to supply chain volatility is by adopting a digital supply network (DSN). This step enables a company to be more proactive—and more intelligently responsive—in the way it manages its supply chain. With a DSN, supply chain managers can analyze situations digitally and then rapidly craft the appropriate physical actions.
Utilizing GIS to visualize a DSN puts supply chains into a real-world perspective. Smart maps and dashboards provide necessary context to enable strategy and precision within the supply chain. GIS maps and dashboards bring together live operational data and multilayer geospatial data in a single view for enhanced operational awareness.
For instance, car manufacturers are already using GIS to coordinate strategic risk management, mapping the interconnections and dependencies between thousands of tier 1, tier 2, and tier 3 suppliers. When any kind of disruptive event occurs—a factory fire, a catastrophic weather occurrence, labor disturbances, and even large-scale political uprisings—the system enables companies to focus on a specific part and trace it from its source to its destination plant and vehicle program. When these problems arise, the manufacturer’s global crisis managers can resolve them with the least effect on customers and the business itself.
The global coronavirus crisis requires a similar organized effort to mitigate and respond to supply chain disruptions. In the midst of the pandemic, dynamic maps give supply chain managers insight and visibility to keep business moving in the right direction for the sake of employees, customers, and the overall economy. Using a DSN, managers can ask questions like the following: How are tier 1, 2, and 3 suppliers interacting? What is the level of production at various plants? How is traffic at major ports? How quickly are distribution centers moving the products? Are customers and the installed base getting what they need, when they need it?
For example, prior to December 2019, a slowdown at a facility that processes wood pulp—or one that extracts juice from the aloe plant—might not have been cause for concern. Now that bathroom tissue and hand sanitizer are increasingly rare commodities, a problem at any point in their respective supply chains is more serious.
By using dashboards to layer an existing supply chain with emerging consumer and demographic information, companies can anticipate shifts in demand. This, in turn, helps users understand the potential cost of any supply chain disruptions. These GIS tools can also combine sensor data from global Internet of Things (IoT) devices—including GPS and mobile devices—allowing managers to layer geographically specific data.
As the current crisis continues, supply chains will be put under an enormous amount of stress. Their ability to withstand this stress will dictate the health of the companies that rely on them. But more than that, it will reflect how nimbly we, globally, can adapt our systems and institutions in the most perilous times.
See how reliable data is helping businesses respond to COVID-19; and access maps, resources, and other support from Esri.
Original Source: https://www.forbes.com/sites/yasamankazemi/2020/04/30/how-maps-and-data-are-helping-businesses-respond-to-covid-19-supply-chain-disruptions/#31b114e42586